.
Part 4: Exploit Development (Buffer Overflows)
This part of the project/course took me on a journey deep into the hexadecimal underworld of computer memory and registers. The destination? A remote reverse shell with administrator privileges, gained by exploiting a buffer overflow vulnerability using custom code. Along the way, I learned all about the anatomy of computer memory, registers, how a buffer overflow works, debugging programs at the hexadecimal level, x86 Assembly, spiking, fuzzing, pattern strings, hexadecimal character validation, identifying vulnerable modules, and generating malicious machine shellcode.
Introduction
For reference:
- IP address of my Kali machine: 10.0.2.4
- IP address of the victim machine, codenamed Buff Guy (Windows 10 Enterprise): 10.0.2.15
- Vulnserver (vulnerable server with a buffer overflow vulnerability) port: 9999
The lab environment for this demonstration, which will show how to identify and exploit a buffer overflow vulnerability using custom code, uses the machines and software listed above. Additionally, Immunity Debugger, a software vulnerability debugger, is used analyze the victim machine’s memory and registers at the hexadecimal level throughout the entire exploit development process. Although the victim machine in this demonstration runs Windows 10 Enterprise, any Windows 7 or newer operating system will suffice.
All parts of this demonstration run Vulnserver and Immunity Debugger on the victim machine with administrator privileges. By doing so, this will allow a remote administrator shell to be automatically gained once the exploit is finished and launched in the end. However, even if Vulnserver is run without administrator privileges, a remote shell — albeit one without administrator privileges — would still be obtained in the end. In any case, both scenarios can be leveraged by a malicious actor.
Anatomy of Computer Memory, Registers, and Buffer Overflows
Before touching any computers, some computing fundamentals must be laid out in order to understand how buffer overflows work in theory.
// Anatomy of Computer Memory
The anatomy of random access memory (RAM), at the highest level, can be divided into two areas: the operating system area and the user space area. As the name suggests, the operating system area, which is a protected area, contains currently running parts of the operating system. On the other hand, user space is reserved for currently running user-level programs.
The operating system area contains:
- The Kernel — The core component of the operating system that manages system resources, provides services, and controls access to hardware.
- Device drivers — Software components that facilitate communication between the operating system and hardware devices.
- System daemons — Background processes that perform various system-level tasks and provide services to user programs.
- System libraries — Collections of precompiled code that provide common functions and routines for use by user programs.
- Other system-related components and data structures.
The user space area contains four regions. Although all user-level programs reside in user space, these four regions are not shared by all user programs; instead, each user program running in memory has its own separate user space, which is divided into the four regions:
- Stack — A region of memory used for managing function calls and local variables.
- Heap — A region of memory used for dynamic memory allocation.
- Data — The portion of memory that stores global and static variables with predetermined values.
- Text — The section that contains the compiled machine code instructions of the program.
Both the operating system area and the user space area can also have reserved memory spaces that serve specific purposes, such as direct hardware access, specialized data structures, or system-level operations.
It’s important to note that the organization and terminology used to describe memory anatomy can vary depending on the context and specific operating system. However, this summary captures the main components and areas of memory in a computer system.
// The Stack
It’s time to dive deeper into memory and into the stack, where buffer overflows happen.
The stack is a region of memory that manages function calls, local variables, and helps maintain the order of execution of a program. It operates on a last-in, first-out (LIFO) principle, meaning the most recent item added to the stack is the first one to be removed. The stack is made up of function call frames, as known as stack frames, which are portions of the stack that are allocated for individual function calls.
These stack frames contain essential information related to the function, such as its parameters, local variables, and the return address. The function call frame helps maintain the order of execution and ensures that each function has its own isolated workspace within the stack.
When a function is called, a new frame is created and pushed onto the stack. This frame includes the function’s parameters, its local variables, and the return address, which indicates the location in the program where the execution should continue after the function has completed. The creation of a new frame ensures that the called function has its own dedicated memory space, preventing interference with other function calls on the stack.
As the program executes and functions are called and completed, the stack grows and shrinks accordingly. Each time a function finishes, its frame is removed from the stack, and the execution resumes at the return address. This process demonstrates the last-in, first-out (LIFO) principle in action, as the most recent function call is always the first to be removed from the stack.
// Registers + Buffer Space
Furthermore, these are the other key components that contribute to the stack’s operation: the Extended Stack Pointer (ESP), the buffer space, the Extended Base Pointer (EBP), and the Extended Instruction Pointer (EIP).
- Extended Stack Pointer (ESP) — The ESP is a register on the CPU that keeps track of (i.e., points to) the top of the stack. It points to the current location where new data can be pushed onto the stack or where the most recent data can be popped off. As function calls are made and completed, i.e., when frames are pushed onto or popped from the stack, the ESP is automatically updated to reflect the changing size of the stack.
- Buffer Space — The buffer space is a portion of the stack frame, allocated for the storage of temporary data used by the frame’s function, such as local variables and intermediate values. This space ensures that each function has its own dedicated area to store and manipulate data without interfering with other functions on the stack.
- Extended Base Pointer (EBP) — The EBP is another register within the CPU, which points to the base (bottom) of the current function call frame (i.e., the latest one added). It serves as a reference point for accessing the function’s parameters and local variables in a consistent manner. By maintaining a stable reference to the base of the frame, the EBP allows the program to manage memory efficiently and avoid errors that could arise from accessing incorrect memory locations.
- Extended Instruction Pointer (EIP) — The EIP is a crucial register within the CPU that holds the memory address of the next instruction to be executed. As the program runs, the EIP is continuously updated to point to the subsequent instructions in the sequence. When a function is called, its function call frame, which contains the return address, is added to the stack. The EIP is then updated to point to the called function’s first instruction. Then, the EIP is continuously updated throughout the execution of the entire function. Once the function is completed, the return address is used to update the EIP, which tells the CPU to continue execution at the appropriate point in the parent function that called the current one.
The three registers listed above have different names and sizes depending on the processor architecture. In 32-bit x86 systems, the registers are each 4 bytes long and they have the same names listed above. Meanwhile, in 64-bit x86_64 systems, the registers are each 8 bytes long and the first word in each of their names is replaced with the word “register”, which gives the following names: Register Stack Pointer (RSP), Register Base Pointer (RBP), Register Instruction Pointer (RIP). Furthermore, if you use a debugging program to inspect a 32-bit x86 user program running on a 64-bit x86_64 PC, the registers shown in the debugging program will have the names and sizes of the x86 architecture, even though the user program is being run on a 64-bit x86_64 PC.
Overall, these components work together to ensure the efficient operation of the stack, facilitating the execution of function calls, the management of local variables and parameters, and maintaining the proper order of execution within a program.
// What Is a Buffer Overflow?
A buffer overflow is a software vulnerability that happens when a program writes data beyond the boundaries of a buffer allocated in memory. This can happen when the program does not properly validate the size of input data, allowing an attacker to supply more data than can be stored in the allocated buffer. As a result, the excess data overflows into adjacent memory regions, potentially overwriting important data, including the return address stored in the EIP register. By carefully crafting the input, an attacker can overwrite the EIP return address with a different address, causing the program to jump to that new address and execute malicious arbitrary code. This can lead to unauthorized access, control, or disruption of the vulnerable program or system.
Theory out the way, it’s time to get our hands dirty with some practical hands-on experience!
Spiking
It’s now time to put all that theory into real tangible action.
Let’s begin by booting up Vulnserver and Immunity Debugger on the victim machine (codenamed Buff Guy), making sure to run these programs as administrator. On the attack Kali machine, running the nc -nv 10.0.2.15 9999 command connects us to Vulnserver, the vulnerable server we will be exploiting. This is what your command line should show after running the Netcat command:
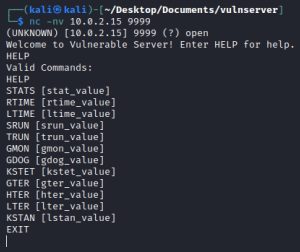
As you can see, Vulnserver lets you use a set of commands to interact with it. The very first step in identifying the buffer overflow vulnerability in this server is finding out which of these commands trigger a buffer overflow. The process by which we will identify this vulnerable command is called spiking. Spiking is the process of sending your target a bunch of characters of varying sizes via multiple commands to determine which command causes your target to crash. Such a crash indicates the presence of a buffer overflow.
In this case, the exact spiking process involves using a simple three-line SPIKE script that simply takes a Vulnserver command, appends a mutating string to it, and sends it over to Vulnserver repeatedly. This string mutates by constantly changing its size every time it is sent. Here’s what the script looks like:
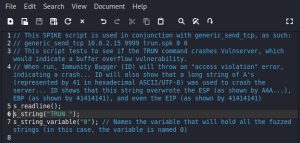
The script above uses the TRUN command to send over the mutating string. To test the other commands, simply replace the string in line 6 with whatever command you want to test. For every command, the script needs to be run in its entirety to really make sure if commands are vulnerable or not.
After testing all commands, we find that the TRUN command causes Vulnserver to crash:
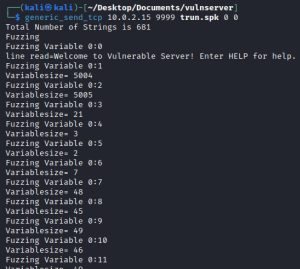
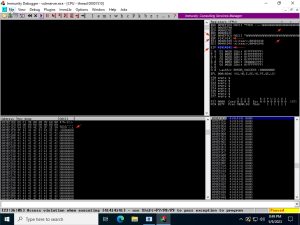
The first image above shows Kali launching the SPIKE script via the generic_send_tcp utility. As you can see, the SPIKE script sends over 681 strings of varying sizes. The second image is of Immunity Debugger, which shows an “Access violation when executing [41414141]” error at the bottom (to the left of the yellow “paused” box), indicating that a crash has occurred. Upon further inspection, Immunity Debugger reveals other important information. The first thing it reveals is that, as you can see, the mutating string is just a bunch of ‘A’ letters. Before proceeding, one must understand that the hexadecimal representation of ‘A’ in ASCII is 41. That said, the second thing Immunity Debugger reveals is the extent of the buffer overflow: the ESP, EBP, and EIP registers have all been overwritten. You can tell because the values next to these registers is either ‘AAAAAA…’ or 41414141 (four A’s put together).
Now that we have found our vulnerable command, the next step is fuzzing the command.
Fuzzing
Fuzzing is similar to spiking in that both processes send a mutating string to the target. However, fuzzing is different in two regards: the number of commands it uses and its goal. Instead of using multiple commands to find which is vulnerable, fuzzing uses one single vulnerable command to send over the mutating string with the goal of finding out roughly at which point the target crashes. Here is the simple Python fuzzing script I wrote:
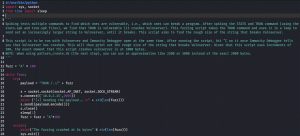
The script takes the TRUN command and uses it in a loop to send out an increasingly larger mutating string to Vulnserver, until it breaks. The string is just a bunch of ‘A’ characters, and it starts out with a length of 100 bytes. Every time the string is sent, the connection to Vulnserver closes, the script waits 1 second, and the size of the mutating string is increased by another 100 bytes before being sent again. After running the script, you must observe for the moment when Immunity Debugger shows a crash. Once a crash is detected, hitting Ctrl+C on the script will output roughly the number of bytes at which the crash occurred.
Let’s put the script to work:
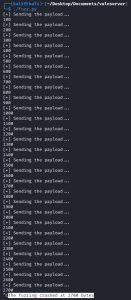
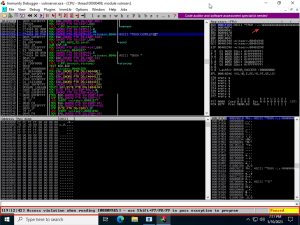
As you can see, the script continuously sends out the mutating string and increases its size by 100 bytes every time. Once I noticed that Vulnserver crashed, as shown by Immunity Debugger image above, I stopped the script, which told me that the fuzzing crashed at a string length of about 2700 bytes. If you look closely, neither the ESP, EBP, nor EIP were overwritten this time; but that’s okay because, like I said, the purpose of this script is to roughly calculate the string size needed to crash Vulnserver.
With this information, we can now proceed to pinpointing the exact location of the EIP, i.e., the string length needed to overwrite the EIP with exact precision.
Locating and Hijacking the EIP
To pinpoint the EIP, a special string needs to be crafted and sent out via the TRUN command. Unlike the previous random strings sent out, this string contains a unique cyclical pattern and is only sent out once. This cyclical pattern string will help us probe the buffer overflow even further, allowing us to discover the string length right before the EIP begins to be overwritten. This string length preceding the EIP is known as the offset. The formula to calculate the string length needed to overwrite the EIP with surgical precision is: offset + size of the EIP. Note that in this case, since Vulnserver is a 32-bit x86 program, the size of the EIP is 4 bytes.
A tool called pattern_create.rb is used to generate the special cyclical pattern string, which is then plugged into a Python script that fires off the pattern to Vulnserver:

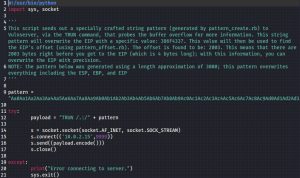
Although the previous fuzz script revealed a crash at a string length of about 2700 bytes, I rounded up the length of this pattern string to 3000 bytes when I generated it, as noted by the -l 3000 option flag. As you can see, unlike in the previous fuzz script, there is no for loop used in this script because the pattern only needs to be sent out once.
Let’s fire off the script and see what happens:
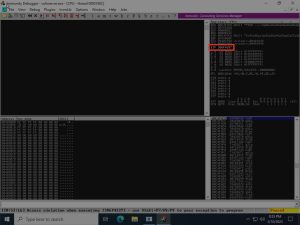
As you can see, this pattern has overwritten the EIP with a certain value, shown in hexadecimal representation as 386F4337 in Immunity Debugger. This hex value can then be used to find the offset using a tool called pattern_offset.rb, as such:

The pattern_offset.rb tool regenerates the same pattern string as before, with the same length, and analyzes it to calculate how many bytes precede 386F4337. The result of this calculation is the offset, which is then returned. In this case, an offset value of 2003 was returned. This means the the EIP sits within byte numbers 2004-2007. With this information, we can now overwrite the EIP with surgical precision, giving us CPU execution control.
Let’s do an EIP overwrite test run:

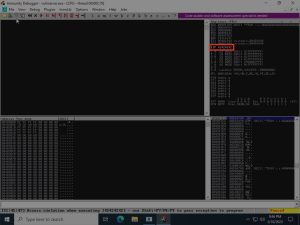
The EIP_owrite_test.py script shown above sends out a 2007-byte string. The offset, the first 2003 bytes, is overwritten by 2003 ‘A’ characters, while the EIP is overwritten with four ‘B’ characters. As you can see, Immunity Bugger confirms that the EIP has been overwritten with these four ‘B’, since it’s showing that the EIP contains a value of 42424242 (the hexadecimal representation of ‘B’ in ASCII is 42). This proves we now completely and totally control the EIP, with the ability to overwrite it with surgical precision.
Hexadecimal Character Validation
Before generating any shellcode, which will be generated in hexadecimal machine code, hexadecimal character validation must be performed. This process, otherwise known as “finding bad characters”, checks to see if any hex characters are interpreted in a special way by Vulnserver. At times, a program might interpret certain hex characters in a very specific way; if any such characters are used by the shellcode, then the shellcode won’t work. As such, any hex characters used by the shellcode must not overlap with any hex characters interpreted differently by Vulnserver. If any bad characters are found, they can then be filtered out at the time of shellcode generation.
The exact process of finding bad characters is done by sending an ordered list/sequence of hex characters over to Vulnserver to see if the server processes any of them in a special way. If any hex characters are uniquely interpreted, Immunity Debugger will show the list of hex characters sent over as out of order in the hex dump. The hex characters that cause the list in the hex dump to be out of order are identified as the bad characters. It’s important to note that in x86 Assembly, the hex character x00 is always uniquely interpreted as the null byte.
Let’s see that process in action:
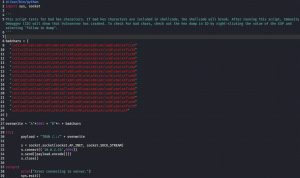
The image above shows what a bad character detection script looks like. The hex list/sequence used here is obtained from a tool called badchars, which generates the hex list for you. To check for bad characters, you simply run this script and then check out the hex dump within Immunity Debugger. If there are no bad characters, the characters in the hex dump will sequentially match the sequence of characters in the script; if there are bad characters, the hex dump will show some characters as out of place in the hex dump, not matching the sequence of the script.
Running this script reveals the Vulnserver contains no bad characters. However, here is an example hex dump (from some other program) within Immunity Debugger showing some bad characters:
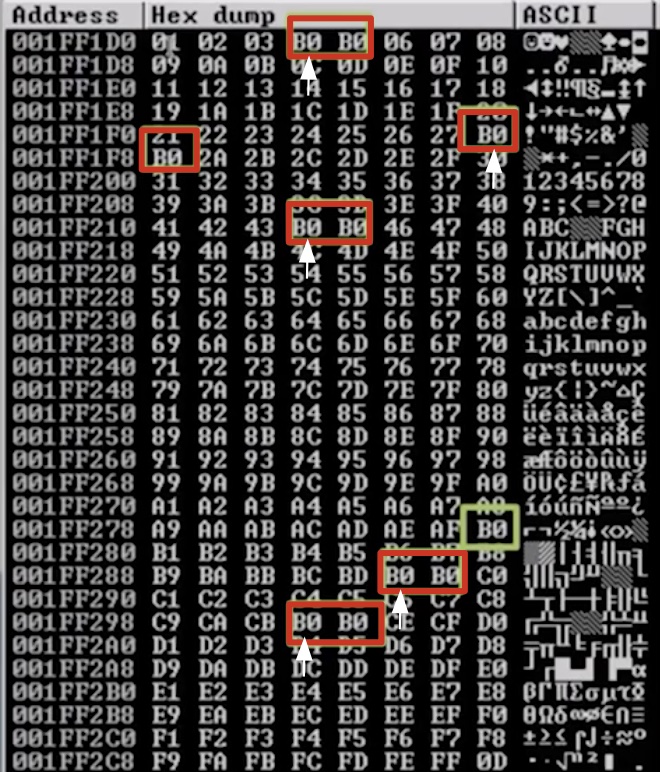
The red boxes reveal pairs of hex characters that are out of place in the hex dump. However, only the first hex character in such pairs are truly considered “bad characters”, which would be excluded when generating shellcode. In this example, these are the identified bad hex characters: 04, 28, 44, BE, and CC. The B0 character highlighted in green is not out of place, since it correctly follows hexadecimal chronological order. That said, it you want to be extra cautious and make sure your shellcode works, you can take out every single highlighted hex character (including all pairs and the B0 highlighted in green).
Finding a Vulnerable Module
The final step before shellcode generation is finding the right module. Before diving in that, some terms must first be defined:
- Module — In the context of software, a module refers to a distinct component or part of a program that performs a specific function. Think of it as a building block or a Lego piece that contributes to the overall functionality of the software.
- DLL (Dynamic Link Library) — A type of module in Windows operating systems that contains reusable code and data that multiple programs can use simultaneously.
- DEP (Data Execution Prevention) — A security feature that helps prevent the execution of malicious code in memory by marking certain areas of memory as non-executable, making it more difficult for attackers to exploit vulnerabilities.
- ASLR (Address Space Layout Randomization) — A technique that randomly arranges the positions of key data areas in memory, including the stack, heap, and libraries, making it harder for attackers to predict and exploit memory addresses.
- SafeSEH (Safe Structured Exception Handling) — A technique that helps protect against exploits targeting structured exception handling mechanisms. It ensures that the exception handling process is performed securely and prevents the execution of malicious code during exception handling.
- Structured Exception Handling (SEH) — A mechanism in programming languages, particularly in Windows operating systems, that allows for the handling of exceptions, which are abnormal conditions or errors that occur during program execution. SEH provides a structured way to catch and handle these exceptions, enabling developers to gracefully manage errors and prevent crashes.
Those terms out of the way, finding the right module can now be discussed.
Since the EIP is now under our surgically precise control, the next step is to overwrite it with a memory address that points to a JMP ESP command, which is an x86 Assembly command that that directs the CPU to the next code that needs to be executed. Of course, that next code to be executed will be our malicious shellcode. For the exploit to work, a specific instance of the JMP ESP command within a vulnerable Vulnserver module needs to be used. A vulnerable module is one that doesn’t use memory protections such as DEP, ASLR, and SafeSEH.
Let’s see how such vulnerable module can be found:
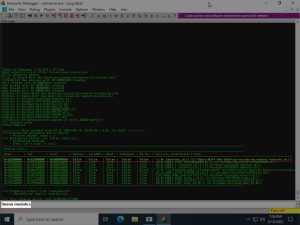
A tool called mona.py allows the !mona modules command to be run in Immunity Debugger. As shown in the image above, this command reveals all the modules being used by Vulnserver. The image also highlights the module we will be abusing: essfunc.dll. As you can see, the module shows a value of ‘false’ under every memory protection, making it perfect for abuse.
Now we need find out if the essfunc.dll module uses any instance of the JMP ESP command:

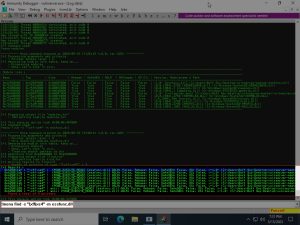
As shown above, the first thing that needs to be done is finding opcode of the JMP ESP command, which turns out to be: FFE4. This was found using the nasm_shell.rb tool, which translates between x86 Assembly and opcode. This opcode is then used in the mona.py !mona find -s "\xff\xe4" -m essfunc.dll command, which finds all instances of the JMP ESP command used by the essfunc.dll module. The command returns all instances along with their respective memory addresses, as highlighted above. This demonstration uses the first JMP ESP memory address in the list shown above: 0x625011af.
This 0x625011af memory address, pointing to an instance of the JMP ESP command within a vulnerable module used by Vulnserver, can now be used to overwrite the EIP. Let’s do a test run of that:

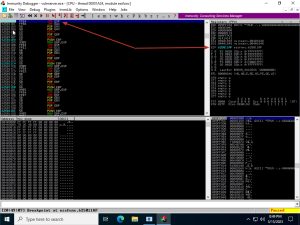
The jumpcode.py script shown above does a test run that successfully overwrites the EIP with the 0x625011af memory address of the JMP ESP command. Note that in the script, the memory address has to be inputted backwards due to the way x86 architecture stores multi-byte data using a format called Little Endian Format. Proof of this successful overwrite can be obtained using a breakpoint at the 0x625011af memory address within Immunity Debugger, as shown above.
Currently, this JMP ESP memory address points nowhere. The only thing left to do now is to generate malicious shellcode, so that the memory address can point to it.
Generating and Launching Malicious Shellcode
The last steps of this exploit development process are to generate malicious shellcode, inject it into a script, and fire off the script. Here’s what these last few steps look like:
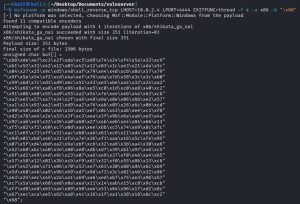
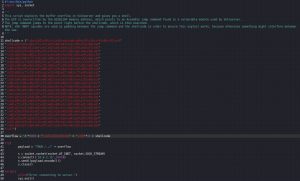
The malicious shellcode was generated via msfvenom. Note that the EXITFUNC=thread option is included for increased payload stability, the -a x86 option specifies x86 architecture, and the -b "\x00" option specifies bad characters to avoid. In this case, only the x00 null byte is excluded since no other bad characters were found earlier. This machine code payload is then injected into the buffer_overflow.py script shown above. Note that script includes "\x90"*32 in between the JMP ESP return address and the shellcode; x90 is the opcode for the x86 Assembly NOP (No Operation) command, which basically does nothing. These 32 NOP commands do nothing but add padding between the JMP ESP return address and the shellcode. This padding is necessary between these two points because otherwise, something may interfere between them which may result in no shellcode execution.
The very last step is to run a listener and run the script:

As you can see, a reverse shell was obtained. To prove that this shell is running as administrator, I simply created a .txt file in the C:\Program Files (x86)\ directory. This action can only be performed in a shell running administrator privileges.
Buff Guy has now been completely and totally pwned.
{$}
<contact_me>
Fill out the form below to reach out to me!